Consulting Analyst
Projects
A sample of my work
Operations Analytics
- Data Extraction from any database or company ERP software with an API
- Live Interactive Dashboards refreshable with a click of a button
- Integrate current Excel reports
- Use power of AI for improved decision making
Book a free discovery call
Supply Chain Analytics
Inventory Reporting Dashboard
KPIs tracked:
- Global Inventory Distribution
- Global Inventory Trend
- Inventory Distribution by Location & Bins
- Inventory by Process Category: Net, WIP, Finish
- Inventory by Item Category: Metal, Rubber, Plastic...
Data Source: Microsoft Dynamics ERP
Data Modeling & Visualization: Power BI

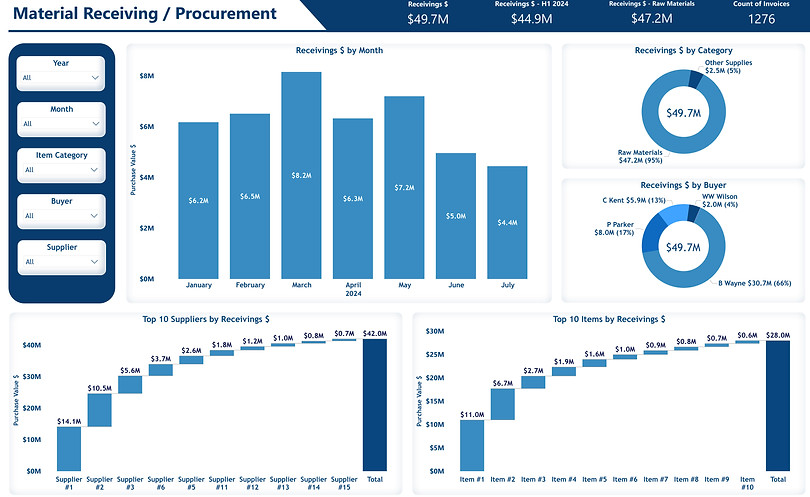
Material Receiving Analysis
KPIs tracked:
- Monthly Procurement Trend $
- Receiving's $ by Category
- Receiving's $ by Buyer
- Top 10 Suppiers by Receiving's $
- Top 10 Items by Receiving's $
Data Source: Microsoft Dynamics ERP
Data Modeling & Visualization: Power BI
Open Purchase Order Analysis
KPIs tracked:
- Monthly Open Purchase Orders $
- Open Purchase Orders $ by Category
- Open Purchase Orders $ by Buyer
- Top 10 Items by Open Purchase Order $
- Top 10 Items by Open Purchase Orders $
Data Source: Microsoft Dynamics ERP
Data Modeling & Visualization: Power BI

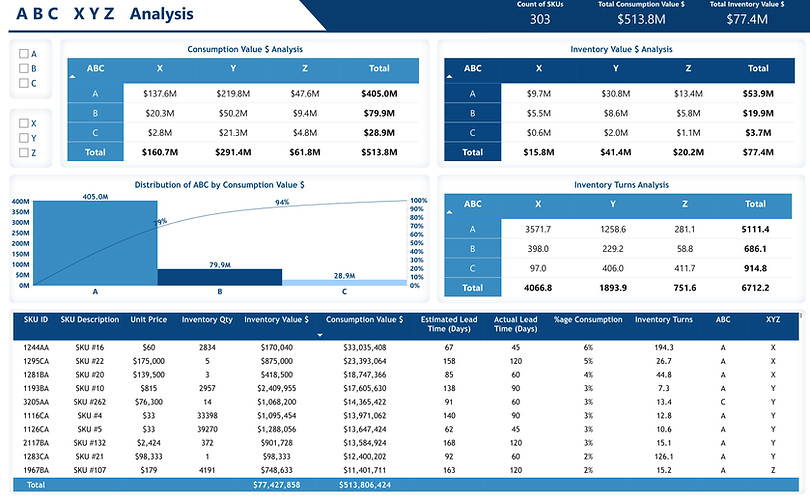
ABC XYZ Inventory Analysis
KPIs tracked:
- Distribution of Items to ABC XYZ Category by Annual Consumption Value $
- Distribution of Items to ABC XYZ Category by Average Inventory Value $
- Analysis of Inventory Turns
- 5% Items make 80% Consumption: A Category
Data Source: Microsoft Dynamics ERP
Data Modeling & Visualization: Power BI
Freight Revenue Analysis
KPIs tracked:
- Revenue $ by Truck Type
- Weight of Cargo moved by Truck Type
- Top 5 States by Revenue $
- Top 5 Trucks by Revenue $
- Expense $ Distribution by Truck Type
- Profit after Expenses $ by Truck Type
- Net Profit $ per Vehicle by Truck Type
Data Source: Microsoft Dynamics ERP & Oracle DB
Data Modeling & Visualization: Power BI

Item Ageing Analysis
KPIs tracked:
- Inventory Value $ by Ageing Group
- Inventory above 180 Days by Warehouse Location
- Inventory above 180 Days by Buyer
- Top 10 Items by Inventory Value $ above 180 Days
Data Source: Microsoft Dynamics ERP
Data Modeling & Visualization: Power BI

Financial Analytics
Balance Sheet Analysis
KPIs tracked:
- Assets vs Liabilities + Equity
- Distribution of Assets
- Distribution of Liabilities + Equity
An Automated Balance Sheet Report refreshable with just a click!
Data Source: Microsoft Dynamics ERP, Excel & Oracle DB
Data Modeling & Visualization: Power BI

Accounts Receivable Analysis
KPIs tracked:
- Receivables $ by Month (Actuals & Forecast)
- Distribution of Receivables $ by Region
- Receivables $ vs Sales $ by Month
- Receivables $ by Ageing Group
Data Source: Microsoft Dynamics ERP, Excel & Oracle DB
Data Modeling & Visualization: Power BI

Accounts Payables Analysis
KPIs tracked:
- Payables $ by Month (Actuals & Forecast)
- Top 10 Suppliers by Payables $
- Payables $ by Supplier Category
- Payment Terms vs Actual Days to Payment
- Payables by Ageing Group
- Payables $ by Item Category
- Upcoming Payments $ by Ageing Group
Data Source: Microsoft Dynamics ERP, Excel & Oracle DB
Data Modeling & Visualization: Power BI

Income Statement
Automated Income Statement on Excel
Data Source: Microsoft Dynamics ERP, Excel & Oracle DB
Data Modeling & Visualization: Jet Reports & Excel

Cash Flow Statement
Automated Cash Flow Statement on Excel
Data Source: Microsoft Dynamics ERP, Excel & Oracle DB
Data Modeling & Visualization: Jet Reports & Excel
